Our aging, shifting population

Every day, all over Canada, decisions are made that will ultimately shape our cities. These decisions dictate how and where cities will grow and shrink. They try to optimize the comfort, transport, safety, and sanitation for the people and their surroundings. In short, today’s municipal decisions are attempting to socially engineer a better future for Canadians and Canadian cities. This begs the question of how these decisions are made, who makes them, and what information is guiding them.
This article will concentrate on the latter by quickly reviewing the methodological differences in how future population information is produced. A best methodological alternative for local scale population projection is recommended and, using this method, projections for every municipality (with a population above 10,000) in Alberta, British Columbia, and Ontario have been calculated. Key results and trends in population change, dependency, and aging are highlighted as we look toward the demographic future of Canadian cities. Although calculating population projections can be a complex task, this is not a technical paper. This article will provide a baseline understanding of a few projection methods to give insight to the data that guides so many municipal decisions. Furthermore, it will provide comparable municipal forecasts, specifically examining projected growth, shrinkage, and dependency – ultimately allowing for a deeper understanding of the differences and similarities in municipal trajectories.
Population Projection Methods
Population projections are among the key inputs to almost every municipal decision. These projections are probabilistic indicators of how the population will change over time. This is essential information, not only for future developments, but also for school and hospital capacity, protection services, public transportation, and much more. It is generally accepted that population projections are crucial to the planning and development process; yet, at the local level, little attention is paid to how such projections are made.

Statistics Canada publishes robust, accurate projections at both the national and provincial level. Their publications are consistent and thorough, and their methods transparent. However, once the jurisdictional scale moves to the local lens, there ceases to be any single organization widely producing projections. This means that municipalities are left to their own devices in calculating these figures. Furthermore, there are no regulations, guidelines, or best practices currently available to instruct actors within the individual municipalities. This has resulted in a wide range of methods, assumptions, and levels of accuracy in forecasting populations. For example, the City of Belleville employs extrapolation techniques, both linear and polynomial, to calculate their projected population.1 This means they are relying exclusively on past trends in population to forecast future change. Surely there is more to calculating future populations than simply assuming past trends will remain steady?
In the City of North Bay, a housing unit method is used to project their population.2 This, in short, means that the forecasted population is based on the development of new housing. They are assuming that average occupancy will hold true for any new housing built. The assumption that an increase in housing development guarantees a similar increase in population is not only a volatile basis for planning decisions, but also counterintuitive. However, at least projections are being made; in some smaller municipalities, they are not produced at all.
The lack of methodological consistency across cities makes municipal comparison ineffectual, and this has implications for a regional understanding of development, competition, and collaboration. Furthermore, poor projections leave individual municipalities vulnerable to making long-term decisions based on inaccurate information. Larger metropolitan areas such as Toronto, Montreal, and Vancouver have both the monetary and human resources to invest in more complex, expensive, and time-consuming methods similar to those used by Statistics Canada; smaller municipalities must work within much tighter monetary constraints, even though population projections are just as vital to their planning and development as they are to the big-city counterparts.
Ongoing research in the School of Planning at the University of Waterloo has investigated this issue through a nine-indicator analysis of population projection methods for small and mid-sized cities. This research concluded that a share-capture model is most appropriate at the local scale.3 A share-capture model essentially assumes that the local, municipal share of a surrounding region’s population will remain consistently proportional into the future. This method is only possible with available projections for the surrounding region – presumably calculated with monetary and human resources that are not available at the local level. In Ontario and Alberta, this is possible with census division-level projections from the Ministry of Finance and from the Treasury Board and Finance Ministry respectively. In British Columbia, the P.E.O.P.L.E. database from BC Stats provides sub-provincial population projections at various geographic levels. The share-capture model was applied for all municipalities (with a population above 10,000) in these three provinces, projecting populations to the year 2036.
Projected Population Change
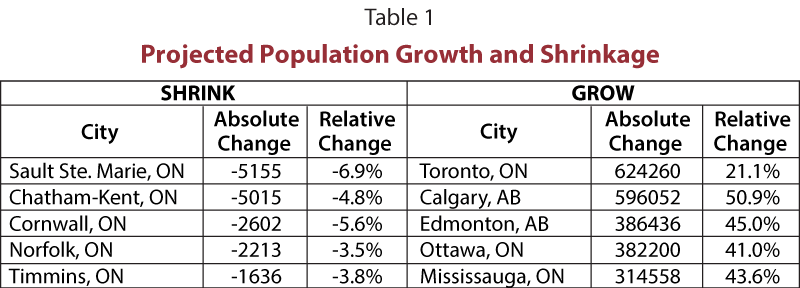
The results from three of Canada’s largest provinces are not overly surprising. Predictably, there is widespread growth projected across Alberta with Wood Buffalo expecting exceptional (53 percent) growth. The majority of British Columbia is also expected to grow, albeit at a slower pace, with the exception of the shrinkage of some resource-based communities such as Powell River (expected to shrink by 10 percent). There is less parity amongst the projections for Ontario municipalities. Southern Ontario is predominantly expected to grow, especially surrounding the Greater Toronto Area; yet, there are pockets of projected population decline on the outskirts of Ottawa and in southwestern industrial areas. Large swaths of the northern half of the province are expected to remain stagnant, grow very slowly, or shrink. In general, across the provinces, the large metropolitan areas are expected to grow substantially. The highest projected growth and shrinkage for each province are detailed in Table 1.
Dependency Ratio
It would be shortsighted to discuss future demographic trends in the Canadian context without touching on the subject of aging. The nationally rising median age and resulting issues are becoming well known, not only to academics, demographers, and practitioners, but also to the general public. Birth rates across the country have remained, predominantly, beneath the replacement rate, while the mobility of younger, educated adults has resulted in a rise of select migration away from smaller, peripheral towns. Such changes in population are leaving retirees and the elderly – physically, emotionally, and (at times) financially – dependent on a smaller contingent of working citizens. This can be represented by the dependency ratio, which measures the number of older people (aged 65 and above) and young people (aged 0 to 14) per 100 persons of working age (between 15 and 64).

Using the results from the population projections, dependency ratios were calculated for every municipality in Alberta, British Columbia, and Ontario. The projected top five most and least dependent municipalities in these three provinces are listed in Table 2.
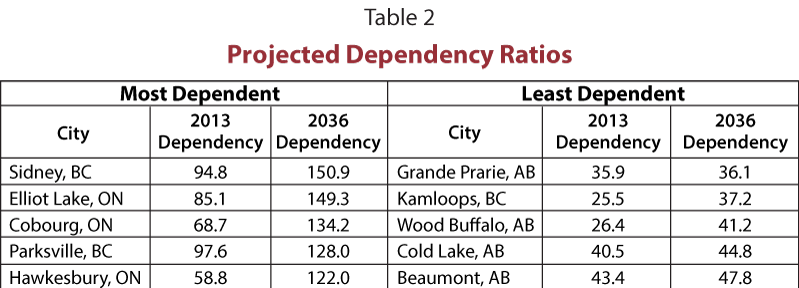
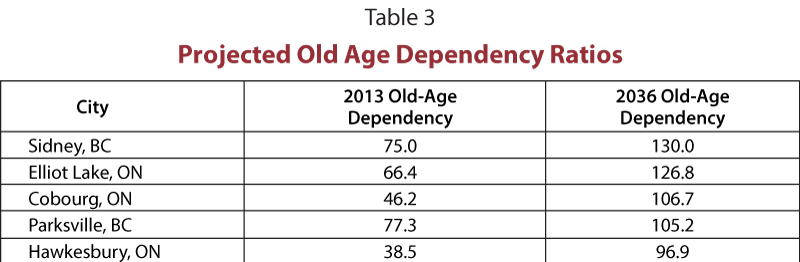
Of the cities that are predicted to have the highest dependency ratios in 2036, four also show the largest projected growth of dependency ratio. Dependency ratios are an important indicator of future demographic change in cities; however, they capture both the old and young dependents. As Canada’s aging population is a growing concern, the dependency ratio only tells part of the story. Table 3 takes a closer look at the cities projecting the highest dependency rates and details the proportional change of population 65 years of age and above. In short, it shows the level of old-age dependency that these cities are projected to experience. Some communities, such as Parksville, already boast a high share of older residents – which has benefits and challenges of its own. But, other cities, such as Hawkesbury, are expected to undergo a radical change in demographics. In contrast, Wood Buffalo’s old age dependency in 2013 was only 2.6, and is expected to rise to 21.7 in 2036 – still a significant jump, but a very different situation than the ones seen in Table 3.
Comparing the population change and dependency tables, there does not appear to be much similarity. Cities with the most extreme growth or shrinkage are not the ones expected to witness the most significant change in dependency. However, it does become clear that cities with relatively high dependency ratios in 2013 are projected to become even more dependent. If we assume that these trends are to continue, these cities of growing old-age dependency might eventually become shrinking cities as death rates rise in unison.
Much work is already being done regarding Canada’s demographic aging; but, as old communities appear to be getting progressively older, perhaps we need more of a conversation around the dichotomy of old and young communities. How will caregiver networks respond to the growing geographical distance between working age populations and retirees? The inter-city relationships between caregivers and support workers and the communities requiring their services need to be at the forefront of aging discussions. And, in order to inform these discussions, and ultimately decisions, local level population projections need to be more robust and consistent across municipalities. Considering the long-term implications of some municipal decisions, ill-informed action could be worse than no action at all. MW
Special thanks to research assistant Brittany Woodhall for her hard work and help calculating all these population projections.
City of Belleville (2010), Population and Household Statistics Population Projections 1.0 – Census Population Trends, pp. 1-5, Belleville, Ontario.
Watson & Associates (2009), City of North Bay Population, Housing and Employment Forecast Update, 2006-2031, pp. 2006-2031, North Bay, Ontario.
M. D. Hartt & C. G. Woudsma (2014), DzHow Many and How Do We Know: Assessing Population Projection Methods in Ontario, Canada,dz Canadian Planning and Policy, 23(1), pp. 83-97
MAXWELL HARTT, M.Sc is a Doctoral Candidate in the School of Planning at the University of Waterloo. He is a member of the Shrinking Cities International Research Network (SCiRN) and the Population Change and Lifecourse Strategic Knowledge Cluster.
as published in the September 2015 issue of Municipal World